TL;DR
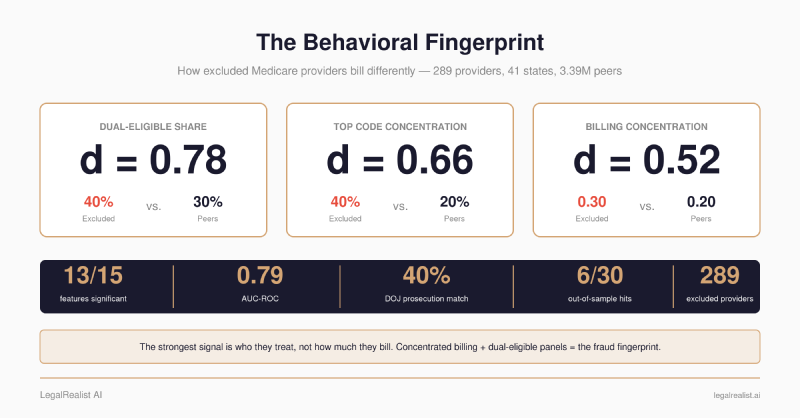
- Excluded providers bill differently from peers — and the signal survives Bonferroni correction on 13 of 15 features. This isn’t a Kaggle exercise. It’s 289 providers excluded for fraud-specific violations across 41 states, matched to real pre-exclusion CMS billing data against 3.39 million peers, same state, same specialty, same year.
- The strongest discriminator is who they treat, not how much they bill. Dual-eligible patient share (d=+0.75) dwarfs every volume metric. Excluded providers serve significantly more Medicaid-Medicare dual-eligible beneficiaries — a population with less oversight and fewer alternative care options.
- Billing concentration is the second clearest signal. Excluded providers derive 40% of revenue from their single most-billed procedure code, vs. 20% for peers. They bill fewer distinct codes and have higher Herfindahl concentration indices. The pattern: high volume on few codes.
- 40% of searched providers link to federal prosecutions — and that’s a floor. Manual search of 43 excluded providers against DOJ press releases returned 17 confirmed matches, with sentences ranging from 15 to 84 months. States with Medicare Fraud Strike Forces showed match rates above 60%; states without them dropped below 15%.
- A fraud-similarity model ranks every active provider — AUC 0.79. Logistic regression trained on the 15 billing features distinguishes excluded from non-excluded billing patterns, but the score is not a calibrated fraud probability. The top feature: single-code billing concentration.
- Some high-scoring providers outside the training labels have independent enforcement histories. Searching public records for the 50 highest-scoring “peers” turned up fraud convictions, DOJ indictments, and OIG enforcement actions — none of which were in the training labels. This shows the signal extends past the exact exclusion list; without a low-scoring control group searched the same way, it does not show the model beats the relevant enforcement-trace base rate.
- The exclusion system has a structural blind spot: entity NPIs. When individual providers are convicted and excluded, their organizational NPIs can keep billing Medicare. The model catches these because it looks at billing patterns, not exclusion lists.
- The majority of excluded NPIs couldn’t be matched to CMS billing data at all. Providers excluded for fraud-specific violations across all states, 2018–2023. Only 289 appeared in CMS Part B utilization files for any pre-exclusion year. The LEIE and CMS billing data don’t talk to each other.
- The data access proposals from the previous post aren’t theoretical anymore — they’re the specific bottlenecks this pipeline hit. Cross-program linkage, longitudinal trends, and structured fraud typologies would each have made this analysis materially better.
Corrections & Updates
- June 23, 2026: Corrected the share of peers flagged at the 0.9 threshold from “less than 3%” to the precise 0.66% (22,410 of 3,393,561), and added context that this is a false-positive-dominated screen — the model projects a fingerprint learned from 289 labeled providers onto 3.39 million, flagging ~78× the underlying exclusion rate.
- June 7, 2026: Updated the False Claims Act recovery figure to the FY2025 results announced January 2026 — a record $6.8 billion, superseding the FY2024 ($2.9 billion) figure originally cited.
The previous post in this series described a backtest pipeline that would test whether excluded Medicare providers show detectable billing differences from peers in the years before exclusion. It outlined the data sources, the join logic, the statistical approach — and noted that nobody had built it. Here are the results.
The Pipeline#
The analysis pulls from three public sources: the OIG’s List of Excluded Individuals and Entities (LEIE), CMS Part B Provider Utilization and Payment Data for 2017–2022, and DOJ Health Care Fraud Unit press releases for prosecution matching.
The cohort: providers excluded under fraud-specific provisions of Section 1128 of the Social Security Act — §1128(a)(1) for program fraud convictions, §1128(a)(3) for felony convictions related to health care, and §1128(b)(7) for excessive services — between 2018 and 2023, across all U.S. states and territories.
For each excluded provider, the pipeline finds the most recent CMS Part B billing year before their exclusion date. A provider excluded in March 2022 gets matched to their 2021 billing data — what their practice looked like in the year before they were caught. The peer group: every other provider in the same state, same specialty, same billing year, with at least 11 beneficiaries.
Fifteen features, computed from provider-level and service-level CMS data: total services, total beneficiaries, unique HCPCS codes, submitted charges, Medicare payments, services per beneficiary, charge-to-payment ratio, average charge per service, payment per beneficiary, beneficiary average age, beneficiary average risk score, dual-eligible share, HCPCS Herfindahl index, top HCPCS code share, and number of HCPCS codes billed.
Statistical tests: Mann-Whitney U (non-parametric, doesn’t assume normal distributions), Welch’s t-test, Cohen’s d for effect size, and Bonferroni correction for multiple comparisons across all 15 features.
The Signal#
289 excluded providers matched to pre-exclusion billing data across 41 states. 3,393,561 peers. 13 of 15 features statistically significant after Bonferroni correction.
| Feature | Excluded Mean | Peer Mean | Cohen’s d | Bonferroni p |
|---|---|---|---|---|
| dual_share | 0.40 | 0.30 | +0.78 | < 0.0001 |
| top_hcpcs_share | 0.40 | 0.20 | +0.66 | < 0.0001 |
| hcpcs_herfindahl | 0.30 | 0.20 | +0.52 | < 0.0001 |
| bene_avg_age | 69.4 | 71.3 | −0.31 | < 0.0001 |
| avg_charge_per_service | $208 | $343 | −0.23 | < 0.0001 |
| bene_avg_risk | 1.8 | 1.6 | +0.18 | 0.0286 |
| unique_hcpcs | 23.5 | 29.4 | −0.18 | 0.0231 |
| n_hcpcs_billed | 32.3 | 41.0 | −0.14 | 0.0043 |
| payment_per_bene | $402 | $325 | +0.10 | 0.0150 |
| charge_to_payment_ratio | 4.2 | 4.6 | −0.07 | < 0.0001 |
| total_benes | 245 | 333 | −0.03 | 0.0009 |
| services_per_bene | 11.8 | 9.1 | +0.02 | < 0.0001 |
| submitted_charges | $336K | $346K | −0.00 | 0.0261 |
Source: analysis of CMS Part B Provider Utilization Data (2017–2022) cross-referenced with OIG LEIE. Data as of May 2026.
Two features did not reach significance: total services (p_bonf = 1.0) and Medicare payment amount (p_bonf = 1.0). Notably, beneficiary average risk score — which was not significant in an earlier ten-state version of this analysis — is now significant (d=+0.18, p_bonf = 0.0286) across the broader cohort. Excluded providers treat slightly higher-risk patients, though the effect is small.
The Fingerprint#
The top three discriminators by effect size are all behavioral concentration metrics, not volume metrics.
Dual-eligible share (d=+0.78). Excluded providers serve a patient panel that is 40% dual-eligible (Medicaid and Medicare), versus 30% for peers. This is the single strongest signal in the dataset — and the most interpretable. Dual-eligible beneficiaries are disproportionately low-income, may have fewer alternative care options, and are subject to different billing rules across two programs. A provider who builds a practice around dual-eligible patients isn’t necessarily committing fraud — many serve this population legitimately. But the concentration is significantly higher among providers who eventually get excluded.
Top HCPCS share (d=+0.66). Excluded providers derive 40% of their billing volume from a single procedure code. Peers derive 20%. This is the revenue concentration signal: practices that bill a narrow set of services at high volume. Combined with lower unique HCPCS counts (24 vs. 29) and higher Herfindahl indices (0.30 vs. 0.20), — excluded providers run less diverse practices.
Average charge per service (d=−0.23). Excluded providers charge less per service — $208 versus $343 for peers. This runs counter to the intuition that fraud involves inflated charges. The pattern instead suggests high-volume, low-complexity billing: many services at lower price points, concentrated on a narrow code set. More services per beneficiary (11.8 vs. 9.1) supports this — excluded providers do more to each patient, not more per service.
The Prosecution Link#
A manual search of 43 excluded providers from the cohort against DOJ press releases on justice.gov returned 17 confirmed matches — a 40% hit rate. Each match links to a federal prosecution with a named defendant, a described fraud scheme, and a sentence.
| Provider | State | Scheme | Outcome |
|---|---|---|---|
| Darrell Bryant | OH | Health care fraud conspiracy with spouse | 84 months |
| Hal Abrahamson | NY | Billed for skin grafts never performed, billed under another podiatrist’s name | 1 year, 1 day |
| Syed Aziz | TX | Part of $60M Medicare fraud ring, 16 co-defendants | Federal conviction |
| Eva Gateva | NY | Named in $110M Zemlyansky mail fraud indictment | Federal indictment |
| Kyrenia Rodriguez | FL | PTA billing through sham home care company | 30 months |
| Suhyun An | TX | Fraudulent billing of acupuncture devices | $2.6M settlement |
| Andrzej Zielke | PA | Unlawfully prescribing opioids and health care fraud via fraudulent Medicaid claims | Federal guilty plea |
| Mark Zager | FL | Conspiracy to commit health care fraud and wire fraud | Federal charges |
Source: DOJ Health Care Fraud Unit press releases, searched via Tavily API restricted to justice.gov. Outcomes as described in original press releases. Full list of 17 matched providers in the backtest-poc repository.
The match rate varies dramatically by state — and the pattern maps directly to federal enforcement infrastructure:
| State | Searched | Matched | Rate |
|---|---|---|---|
| AZ | 1 | 1 | 100% |
| PA | 1 | 1 | 100% |
| TX | 5 | 4 | 80% |
| NJ | 4 | 3 | 75% |
| NY | 3 | 2 | 67% |
| FL | 5 | 3 | 60% |
| MI | 7 | 2 | 29% |
| OH | 7 | 1 | 14% |
| CA | 8 | 0 | 0% |
| GA | 1 | 0 | 0% |
| IL | 1 | 0 | 0% |
Texas, Florida, New Jersey, and New York all host Medicare Fraud Strike Force teams — dedicated federal prosecution units that generate press releases. Ohio matched only 1 of 7 providers searched. California matched zero of eight. One likely explanation: state-level prosecution by attorneys general, which produces court records but not justice.gov press releases.
The 40% hit rate is a floor, not a ceiling. Every provider excluded under §1128(a)(1) was convicted — that’s the statutory requirement for that exclusion type. The 60% not found were likely prosecuted at the state level, resolved via plea agreements without federal press releases, or listed under slightly different name spellings in LEIE versus court records.
The billing fingerprint maps to the fraud schemes described in these press releases. A podiatrist billing concentrated procedure codes for skin grafts never performed. A physical therapist routing claims through a sham home care company to dual-eligible patients. A chiropractor running high volume on a narrow set of acupuncture device codes. Concentrated billing, dual-eligible panels, high volume on few services — the same pattern the statistical analysis identified independently. These examples illustrate the overlap, though a systematic mapping between prosecution narratives and billing features across all 17 matches would be needed to confirm the correspondence.
The Model#
A logistic regression trained on all 15 features with balanced class weights produces a cross-validated AUC-ROC of 0.792 — the model ranks excluded providers above non-excluded peers with decent reliability. It is a similarity model, not a fraud-probability model. This isn’t a black box. Every feature’s contribution is a single coefficient, directly interpretable.
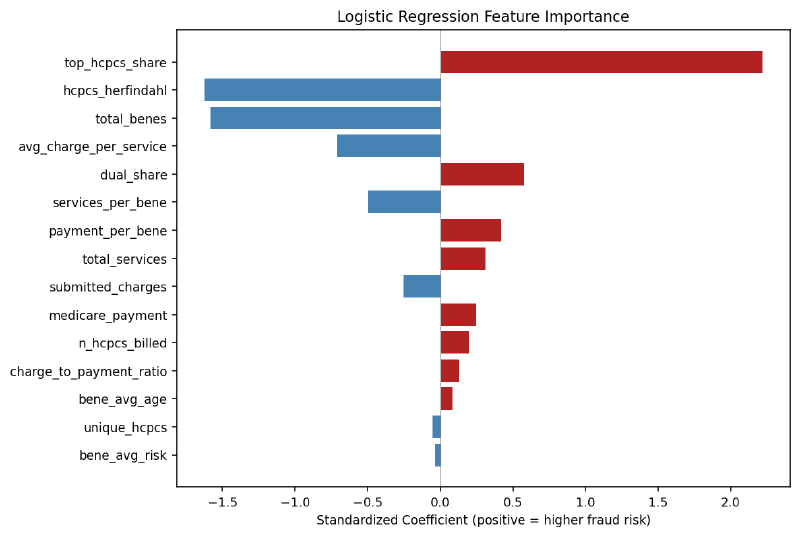
Standardized logistic regression coefficients. Positive = associated with higher fraud similarity. Source: model trained on 289 excluded providers vs. 3.39 million peers.
The top predictors:
- Top HCPCS share (+2.22) — single-code billing concentration is the strongest predictor. A provider deriving 40% of billing from one procedure code scores dramatically higher.
- HCPCS Herfindahl (−1.62) — interacts with top share to capture the shape of billing concentration. A provider concentrated on one code (high top share) versus several codes (high Herfindahl) produces a different similarity signal.
- Total beneficiaries (−1.56) — smaller patient panels score as more similar to the excluded cohort. This is consistent with the high-volume-per-patient pattern.
- Average charge per service (−0.71) — lower charges, reinforcing the high-volume, low-complexity pattern.
- Dual-eligible share (+0.58) — more dual-eligible patients correlates with higher risk, consistent with the univariate finding.
The model scores every one of the 3.39 million peer providers on a 0–1 scale. The distributions separate clearly:
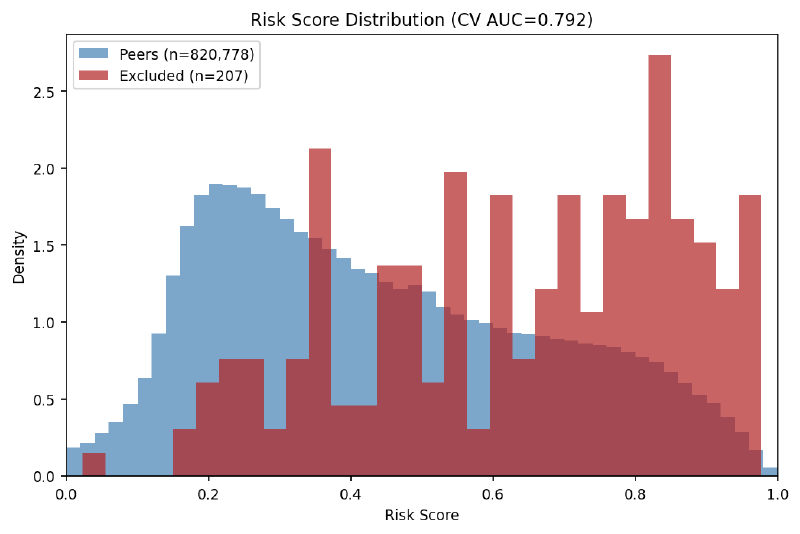
Model-score distributions for excluded providers (red) vs. peers (blue). Excluded providers cluster in the 0.6–1.0 range; peers peak around 0.2. Source: logistic regression with 5-fold stratified cross-validation.
At the 0.9 threshold, 22,410 active peers — 0.66% of the 3.39 million — score as highly similar to the 289 excluded providers. That percentage sounds small, but the absolute number is large. The model learned a billing typology from 289 excluded providers and then projected that typology onto every active peer. The result is a candidate universe almost 78 times larger than the labeled exclusion cohort.
That is the most important limitation in the whole exercise. This is not a model saying “22,410 providers are fraudsters.” It is saying “22,410 providers resemble the 289-provider typology closely enough to inspect.” Even under the generous assumption that every excluded-style provider the model was trained to find sits inside this high-score group, true positives would make up at most 1.3% of the flagged set. The other 98%+ would be providers who merely bill in a statistically similar way, most of whom have done nothing wrong. The 22,410 is a false-positive-dominated triage screen, not a fraud list.
The Validation#
A search of public records — DOJ press releases, OIG enforcement actions, state medical board complaints — for the top 50 highest-scoring peer providers. These providers scored 1.0 (maximum fraud similarity) but were not in the LEIE and were not used as positive labels during training. Of 30 providers searched, 6 had confirmed enforcement actions:
| Provider | State | Specialty | Action | Finding |
|---|---|---|---|---|
| Phlebxpress | CA | Clinical Laboratory | Conviction | Owners pled guilty to $7M Medicare fraud. Each sentenced to 15 months. |
| Advanced Clinical Laboratories | FL | Clinical Laboratory | OIG CIA | False Claims Act violations — added diagnosis codes not provided by physicians. $500K+ recovery. |
| Hemal Mehta | TN | Pain Management | DOJ Indictment | 10 counts, conspiracy to distribute controlled substances. FBI/OIG investigation. |
| Natera, Inc. | CA | Clinical Laboratory | Qui Tam | False claims complaint. $8.25M class action settlement. |
| CareDx, Inc. | CA | Clinical Laboratory | Investigation | DOJ investigation; qui tam lawsuit for improper test bundling and kickbacks. |
| Stephen Dubin | NV | General Practice | Board Complaints | Two complaints with Nevada State Board of Medical Examiners. |
Source: DOJ press releases, OIG enforcement actions, state medical board records. Searched May 2026. None of these providers were in the LEIE training labels.
The pattern within the pattern: all four clinical laboratories in the top 50 had enforcement actions. Labs are the classic Medicare fraud vehicle — ordering unnecessary tests, billing for services not rendered, paying kickbacks to referring physicians. But labs are also among the most-investigated specialties in Medicare, so this may reflect the base rate of enforcement among labs rather than the model isolating fraud from billing patterns alone. The two explanations can’t be separated without searching a low-scoring control group the same way.
A 20% hit rate from billing data is not a conviction rate — and it requires honest accounting. Of the 6 providers with enforcement actions, only 3 involve clear fraud findings: Phlebxpress (conviction), Advanced Clinical Laboratories (OIG Corporate Integrity Agreement for False Claims Act violations), and Hemal Mehta (DOJ indictment). Natera and CareDx both had DOJ investigations that closed with no finding of wrongdoing — counting them as “hits” overstates the model’s validation. Dubin has board complaints, not fraud findings. Scored strictly — conviction, indictment, or CIA only — the rate is 3 of 30 (10%), not 6 of 30. The broader count is defensible because qui tam complaints and DOJ investigations reflect genuine government concern about a provider’s billing, even when they don’t result in a finding. But the distinction matters, and readers should draw their own line.
Twenty-four of the 30 providers searched had no public enforcement record. A high model score means a provider’s billing pattern is statistically similar to providers who were eventually excluded — it is a lead for investigators, not a verdict.
The NPI Gap#
Why weren’t these providers in the LEIE if they had real enforcement actions? Each case reveals a different gap in the exclusion system:
| Provider | Reason Not in LEIE |
|---|---|
| Phlebxpress | Company NPI not excluded — only individual owners excluded under personal names |
| Advanced Clinical Laboratories | Signed Corporate Integrity Agreement as alternative to exclusion |
| Hemal Mehta | Indicted but not yet convicted — exclusion lags years behind indictment |
| Natera / CareDx | DOJ investigations closed with no wrongdoing finding |
| Stephen Dubin | Board complaints only — no conviction or OIG action |
The Phlebxpress case is the clearest illustration of a structural blind spot. The LEIE excludes individuals — Gabriella Santibanez and Lisa Hazard were both excluded in May 2024 under §1128(a)(1) after pleading guilty to $7M in Medicare fraud. But they billed Medicare through the company’s organizational NPI, which was never excluded. The company NPI continued appearing in CMS billing data as a “peer” — a non-excluded provider.
The LEIE records make the gap even starker. Santibanez’s entry lists her NPI as 0000000000 — a placeholder meaning no individual NPI was on file. She was an owner, not a credentialed provider who billed under her own number. Hazard’s entry does have a real individual NPI (1215272042), but neither connects to the company’s organizational NPI that actually submitted the $7M in claims. Even a direct cross-reference between the LEIE and CMS billing data wouldn’t catch this — the NPIs don’t link.
This is not a data quality issue. It is a design gap in the exclusion system. Individual-level exclusion lists cannot catch organizational NPIs that continue billing after their operators are convicted. A fraud detection system built solely on LEIE exclusion records — without cross-referencing organizational NPIs to excluded individuals — will miss these entities. The model catches them because it looks at billing patterns, not exclusion lists — and the billing pattern of a $7M fraud operation looks like fraud regardless of which NPI it bills under.
The Gap#
The pipeline started with every provider excluded under fraud-specific provisions (§1128(a)(1), (a)(3), and (b)(7)) between 2018 and 2023 across all U.S. states. Only 289 appeared in any CMS Part B utilization file for any year between 2017 and 2022 — the majority couldn’t be matched at all.
Several explanations, all of which point to the data fragmentation the previous post described:
- Different program. Some excluded providers billed through Part D (prescribing), DMEPOS (medical equipment), or Medicaid rather than Part B. CMS publishes these as separate datasets with separate APIs, different formats, and different release schedules. A provider who committed fraud through Part D prescribing doesn’t appear in Part B utilization files.
- Below suppression threshold. CMS suppresses data for providers with fewer than 11 beneficiaries. A provider billing a small number of patients at high volume per patient — a common fraud pattern — may be suppressed entirely.
- NPI mismatch. LEIE records aren’t always clean. Some entries have missing or incorrectly formatted NPIs. Some providers operated under organizational NPIs (Type 2) while the billing data uses individual NPIs (Type 1), or vice versa. The NPPES registry could help resolve these, but automated cross-referencing at scale is fragile.
The original design attempted to use DMEPOS data — a category the OIG has identified as particularly fraud-prone. Zero excluded individual NPIs matched. DMEPOS billing is 99.5% organizational NPIs; LEIE exclusions are overwhelmingly individual providers. The entity types don’t align across the two datasets.
Every one of these gaps maps to a data access proposal from the previous post. Cross-program provider linkage would connect Part B, Part D, DMEPOS, and Open Payments records under a single NPI. A unified provider profile would recover many of the missing providers by pulling billing from whatever program the provider actually used.
What This Proves About Data Access#
The pipeline catalogues exactly where public data falls short — not as an abstract policy argument, but as concrete engineering failures encountered while building it.
No cross-program linkage. The majority of excluded NPIs didn’t appear in Part B data. A pipeline that could query across Part B, Part D, and DMEPOS from a single API would have recovered a substantial fraction of those missing providers. The NPI is the join key. CMS has the data. The join isn’t published.
No longitudinal view. Each CMS billing year is a separate dataset with a separate API endpoint and a separate UUID. Building a two-year billing trajectory for one provider in one state requires six API calls, manual temporal alignment, and careful deduplication. The pipeline made 60+ API calls to construct the dataset. A pre-joined longitudinal view — same data, one endpoint per provider — would reduce this to one call per provider.
No fraud typology mapping. The LEIE’s exclusion type codes — 1128(a)(1) for program fraud, 1128(b)(7) for excessive services — are legal categories, not billing categories. The pipeline treats all excluded providers as one group. Segmenting by scheme type (phantom billing vs. upcoding vs. overutilization) should produce tighter, more actionable signatures. But translating exclusion codes into billing patterns requires reference data CMS hasn’t published. The DOJ press releases that describe each scheme in narrative form aren’t machine-readable.
[Medium confidence] A pipeline with access to all three proposed improvements — cross-program linkage, longitudinal trends, and fraud typology mapping — would produce substantially larger effect sizes than what this analysis measured, because it would eliminate the noise introduced by program-siloed data, single-year snapshots, and undifferentiated exclusion labels.
The five data releases proposed in the previous post are the specific pieces this pipeline needed and didn’t have.
Caveats#
- Survivorship bias. Only providers who billed Part B before exclusion appear in the dataset. Providers who committed fraud through other programs, or who were excluded before they generated enough billing volume to appear in CMS data, are invisible.
- Mixed exclusion types. The cohort is restricted to fraud-specific exclusion types — 1128(a)(1) (program fraud convictions), 1128(a)(3) (felony convictions related to health care), and 1128(b)(7) (excessive services) — but these are still different misconduct categories that likely produce different billing signatures. The current analysis doesn’t differentiate.
- Peer matching limitations. Peers are matched by state, specialty, and billing year — not by practice size, sub-state geography, or patient mix. Urban specialists and rural generalists within the same state and specialty are compared directly.
- Practice size confound — tested and mostly resolved. Practice size correlates with many features in the model: smaller practices naturally bill fewer codes, serve fewer beneficiaries, and have higher billing concentration. To test whether the fraud signal is really a small-practice signal, the pipeline bins providers into four size tiers by total beneficiaries (11–50, 51–200, 201–500, 500+), computes Cohen’s d within each tier, and pools the results. 11 of 15 features remain significant after size adjustment (vs. 13 raw). The three core concentration metrics — dual-eligible share, top HCPCS share, Herfindahl index — actually got stronger after controlling for size (d=+0.78→+0.79, +0.66→+0.71, +0.52→+0.60). These are not practice-size artifacts. Features that did lose significance — total beneficiaries, unique HCPCS codes, beneficiary average age — are plausibly size-confounded, and the adjustment correctly identifies them. The behavioral fingerprint is robust to this control.
- Effect sizes are small to medium. The three largest (dual_share, top_hcpcs_share, hcpcs_herfindahl) range from d=0.52 to d=0.78 — meaningful but not diagnostic. These features distinguish populations, not individuals. A high dual-eligible share doesn’t make a provider fraudulent. It makes them statistically more similar to providers who were eventually excluded.
- Temporal variation. Billing years range from 2017 to 2022 depending on when each provider was excluded. Medicare billing norms shifted during this period, particularly around COVID-19. The peer-matching by year mitigates this, but doesn’t eliminate it.
- Model limitations. The logistic regression uses balanced class weights to handle extreme imbalance (289 vs. 3.39 million), which inflates the number of high-scoring peers. Average precision is low (0.0005) because the exclusion-label base rate is low (0.009%). AUC measures ranking quality, not calibration — a 0.9 model score does not mean 90% probability of fraud.
- Validation sample. The out-of-sample validation searched 30 of 50 top-scoring peers. Public records searches are biased toward federal actions and may miss state-level enforcement. The 20% hit rate is a lower bound.
- No control group in the validation. The validation searched only the highest-scoring peers — never a matched set of low-scoring providers using the same method and searcher. That makes the hit rate hard to interpret. The enforcement actions being counted (DOJ investigations, qui tam complaints, board complaints) are far more common than LEIE exclusions, so the relevant base rate is not the 0.009% exclusion rate — it’s the unknown rate at which any searchable enforcement trace turns up for a randomly chosen provider. Without a blind comparison against low-scorers, 20% (or 10% scored strictly) can’t be shown to exceed what an identical search of random providers would return. The clinical-laboratory finding compounds this: labs are both what the model flags and the most-investigated specialty in Medicare, so “all four labs had enforcement actions” may reflect the base rate for labs rather than model lift. The validation demonstrates the model surfaces providers with independent regulatory concern outside its training labels; it does not establish lift over chance.
What Comes Next#
Excluded providers show detectable billing differences on 13 of 15 features — robust enough to build a scoring model and test it against out-of-sample enforcement actions. The prosecution matching linked 40% of searched excluded providers to federal DOJ press releases. The validation found enforcement actions among 20% of the searched top-scored peers — a number that, without a low-scoring control group searched the same way, sets a floor on the signal rather than measuring the model’s lift.
[Medium confidence] Three extensions remain. First, segmenting by exclusion type to see whether different fraud schemes produce different signatures. Second, expanding to Part D and DMEPOS billing to recover the excluded providers this pipeline missed. Third, the entity/individual NPI gap identified in the validation section suggests that cross-referencing the NPPES registry to link individual exclusions to organizational NPIs would close a structural blind spot in the exclusion system.
A model that flags 22,410 providers is not actionable by itself. It is a starting point that demands better data to narrow. That is the same problem the government faces internally. The HEAT Task Force and CMS’s Center for Program Integrity use claims-level data, clinical context, and investigative resources to reduce false positives from statistical screens. Public summary data can identify the behavioral fingerprint, but it can’t distinguish a specialist who legitimately concentrates on one procedure from one who bills it without performing it. That distinction requires claims-level detail — diagnosis codes, dates of service, referring provider relationships — that CMS has but doesn’t publish. More sophisticated modeling may have diminishing returns without better underlying data.
The PPP analysis went from proof of concept to actionable results because the SBA released everything in one table. Medicare’s public data produces a clear signal despite being fragmented across programs, stripped of clinical context, and published as disconnected annual snapshots. The signal would likely be stronger with better data — particularly if cross-program linkage recovered the excluded providers this pipeline couldn’t match. The question is whether CMS will release it.
The next post in this series walks through how the pipeline was built — including the three times it failed, the data duplication bug that survived initial review, and the engineering decisions that shaped the final design.
What a Data Miner Does With This#
The model scores 22,410 active providers above 0.9 — 0.66% of all peers, and a set in which fewer than 2% would be true positives even under generous assumptions. That is too many names for enforcement and far too many false positives for accusation. Billing patterns statistically similar to excluded providers are not the same as fraud; the validation shows only that at least some of these are real. The practical question: what does someone do with a large, noisy list of high-scoring NPIs?
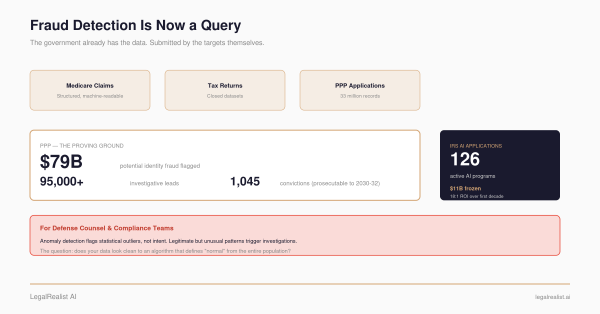
The False Claims Act (31 U.S.C. §§ 3729–3733) allows private citizens — called relators — to file lawsuits on behalf of the federal government against entities that submit false claims to government programs. These are qui tam actions, and they are the primary mechanism through which Medicare fraud data mining becomes economically viable. Relators who provide information the government doesn’t already have can receive 15–30% of any recovery. In FY 2025, the DOJ recovered a record over $6.8 billion in False Claims Act settlements and judgments — the highest single-year total in the statute’s history, with more than $5.7 billion tied to health care — and qui tam relators received hundreds of millions in awards.
The pipeline in this post doesn’t file qui tams. It produces leads. The workflow from model output to legal action involves several additional steps that a data miner or relator’s counsel would need to take:
1. Triage by specialty and geography. Not all high scores are equally actionable. Clinical laboratories — all four in the top 50 had enforcement actions — are historically the highest-yield specialty for FCA recoveries. States with active Medicare Fraud Strike Force teams (TX, FL, NY, NJ) have established federal infrastructure for intervention. A data miner would prioritize providers in high-yield specialties in Strike Force states.
2. Corroborate with public records. A billing anomaly is not fraud. The model identifies providers whose billing patterns resemble those of excluded providers — that’s a statistical lead, not evidence. Before approaching counsel, a data miner would search DOJ press releases, OIG enforcement actions, state medical board records, corporate integrity agreements, and court filings. The validation in this post demonstrates this step: 6 of 30 searched providers had confirmable enforcement histories.
3. Investigate the billing pattern. CMS publishes service-level data — HCPCS codes, utilization counts, and charges for each provider. A high top-HCPCS-share score means one procedure code dominates the provider’s billing. Looking up that specific code, the volume, and the charge amount can reveal whether the pattern is clinically plausible or suggests phantom billing, unbundling, or upcoding. This is where the model’s feature-level transparency matters: the coefficients tell the data miner which dimension of the billing pattern to investigate first.
4. Assess LEIE gap status. The NPI gap identified in this analysis means some high-scoring providers may already have individual operators in the LEIE while the organizational NPI continues billing. Cross-referencing the NPPES registry for ownership relationships and the LEIE for individual exclusions of affiliated persons narrows the field to providers with active, uninvestigated billing anomalies.
5. Engage relator’s counsel. Qui tam complaints are filed under seal and require legal representation. Counsel evaluates whether the billing pattern, corroborating evidence, and dollar amount justify the cost of investigation and litigation. The DOJ intervention rate — the rate at which the government takes over a relator’s case — is the critical threshold. Intervened cases recover significantly more than declined cases.
6. The public disclosure bar. The FCA’s public disclosure bar (31 U.S.C. § 3730(e)(4)) prevents qui tam actions based on publicly disclosed information unless the relator is an “original source.” CMS billing data is public. The LEIE is public. A complaint built entirely on publicly available datasets faces an obvious defense: the government already has this data.
The open doctrinal question is whether novel analysis of public data constitutes new information. The raw data is public, but the behavioral fingerprint — the specific combination of 15 features, the model coefficients, the ranked similarity scores — is not something CMS or OIG has published. No government report identifies these specific billing patterns as fraud indicators. The analysis is original even if the inputs are not. Courts have split on analogous questions in other FCA contexts, and DOJ has not taken a clear position on whether statistical modeling of public billing data qualifies a relator as an original source. This is a doctrinal limitation that matters: if novel analysis of government data doesn’t count, then data mining as a qui tam strategy is dead on arrival regardless of how good the models get. If it does count, then the value of public data releases — and the case for better ones — increases substantially.
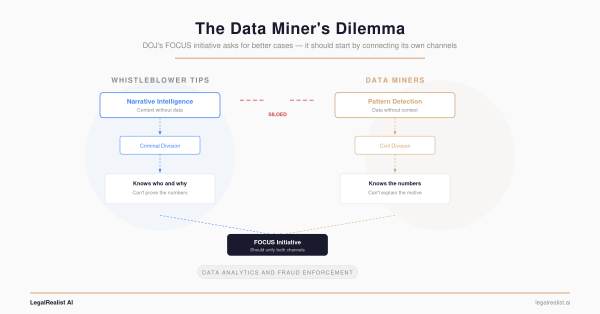
This pipeline is not the first step in that workflow and not the last. It sits between the data access problem and the legal action — turning public billing data into a ranked list of providers whose patterns match known fraud. The Data Miner’s Dilemma described the information asymmetry that makes this hard: the government has claims-level data, clinical records, and investigative resources that relators don’t. This backtest shows that even with public summary data — no claims, no diagnoses, no clinical context — the behavioral fingerprint is detectable.
The government already knows these patterns. The question this series has asked from the beginning is whether publishing fraud typologies — the way FinCEN publishes AML typologies — would help relators build stronger cases faster. This backtest is consistent with the answer being yes: a 15-feature behavioral fingerprint, trained on public data, surfaces providers with real enforcement histories — though showing it outperforms the base rate would take a controlled comparison this public data can’t yet support.
Further Reading#
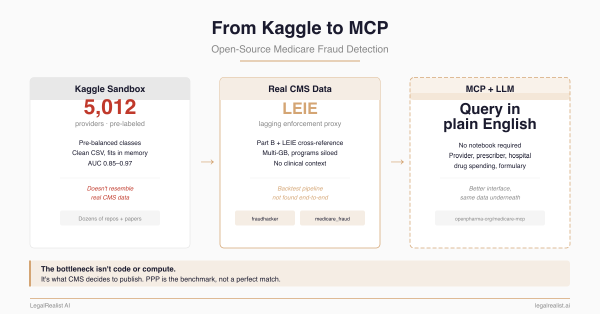
- From Kaggle to MCP: Open-Source Medicare Fraud Detection. The previous post in this series — the repos, the data landscape, and the five data access proposals.
- Show Your Work: The Open-Source PPP Fraud Analysis. The PPP pipeline this backtest is modeled after.
- The Data Miner’s Dilemma. The information asymmetry between public and government data.
- The Government Already Has the Data. How DOJ and CMS use their closed datasets internally.
- DOJ Health Care Fraud Unit. Federal prosecution press releases and Strike Force operations.
- CMS Part B Provider Utilization Data. The billing data used in this analysis.
- OIG LEIE Exclusion Database. The exclusion list used as ground truth labels.
- OIG Exclusion Authorities. The statutory basis for exclusion type codes.
- NPPES NPI Registry. Provider identity verification.
- Herfindahl-Hirschman Index. The concentration metric used for billing diversity.
- Mann-Whitney U Test. The non-parametric test used for group comparison.
- NHCAA: The Challenge of Health Care Fraud. The 3–10% estimated fraud rate.
This post is part of the Data Analytics and Fraud series on LegalRealist AI. It is intended for informational and educational purposes only and does not constitute legal advice. The analysis described here uses publicly available CMS data and OIG exclusion records; no patient-level or claim-level data was accessed. Statistical findings describe population-level differences and do not constitute evidence of fraud for any individual provider. Open-source code and methodology will be published separately. AI capabilities, data availability, and enforcement practices described here reflect publicly available information as of the publication date and are subject to change. Laws governing healthcare fraud, data privacy, and qui tam litigation vary by jurisdiction.